Understanding & Tracking Your BBT
Holistic Fertility with Fion

Your temperature has been
telling you a story all along.

Basal body temperature won't predict ovulation — but read correctly, it confirms what already happened inside your cycle, and tells you a great deal about your hormonal and TCM landscape along the way.

01 · The hormonal picture

What basal body temperature actually measures

Two hormones, one thermostat.

Basal body temperature (BBT) is your body's resting temperature, taken first thing in the morning, before you get out of bed, move around, eat, or speak. It is the lowest, most stable reading your body produces in 24 hours — which is exactly why it's useful. It strips away the noise of digestion, movement, and stress, leaving a fairly clean readout of one thing: which hormone is currently dominant in your cycle.
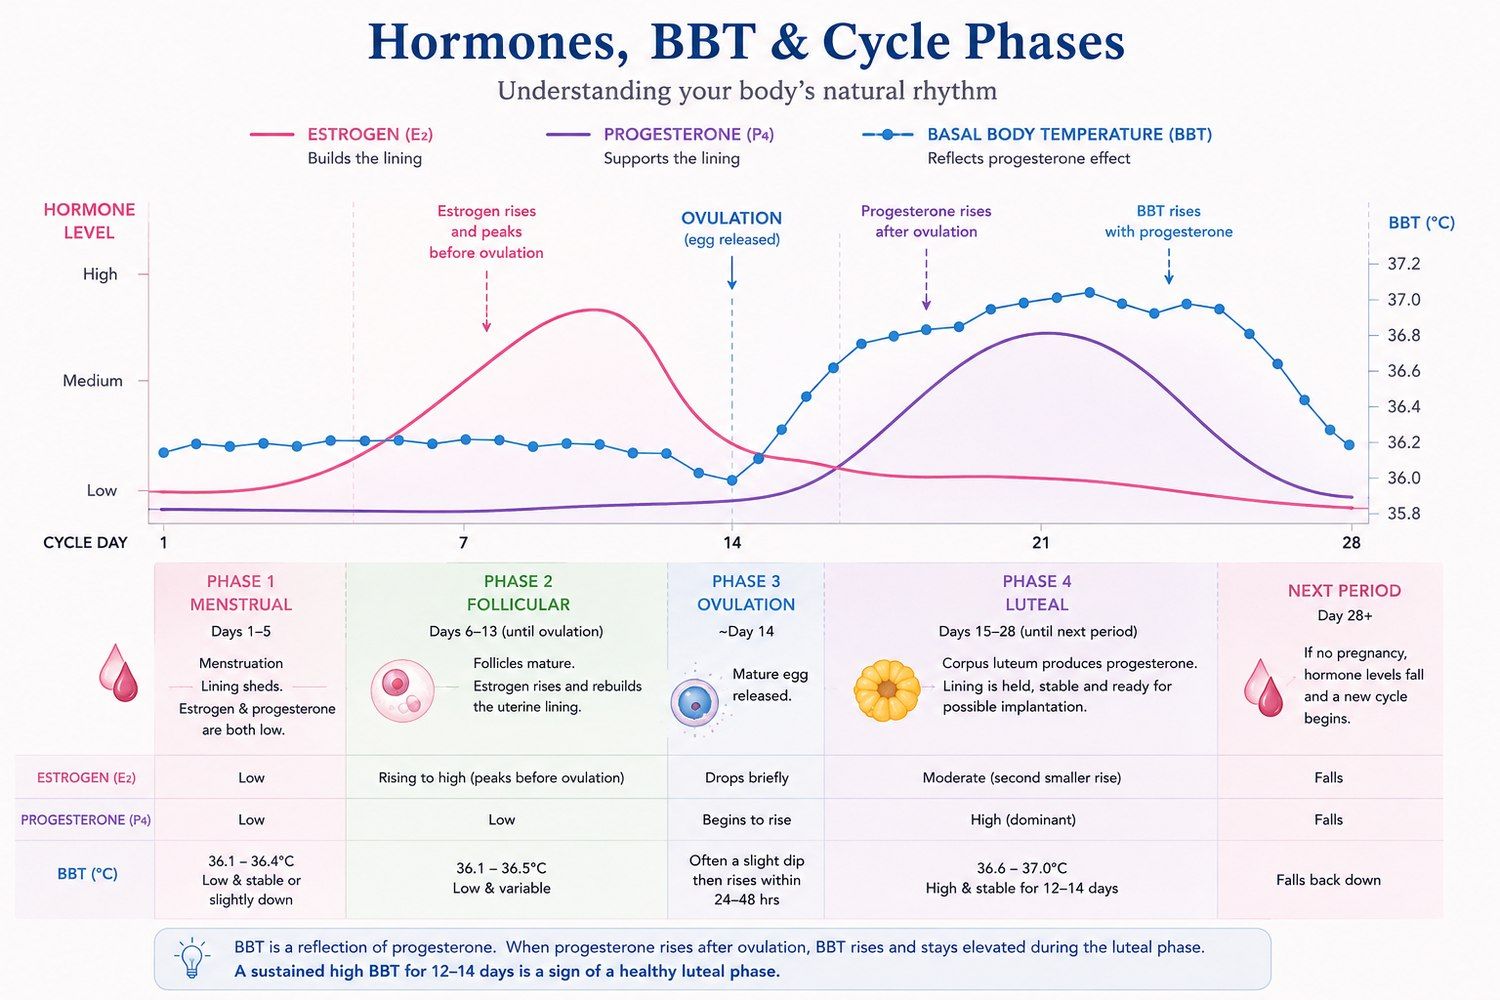
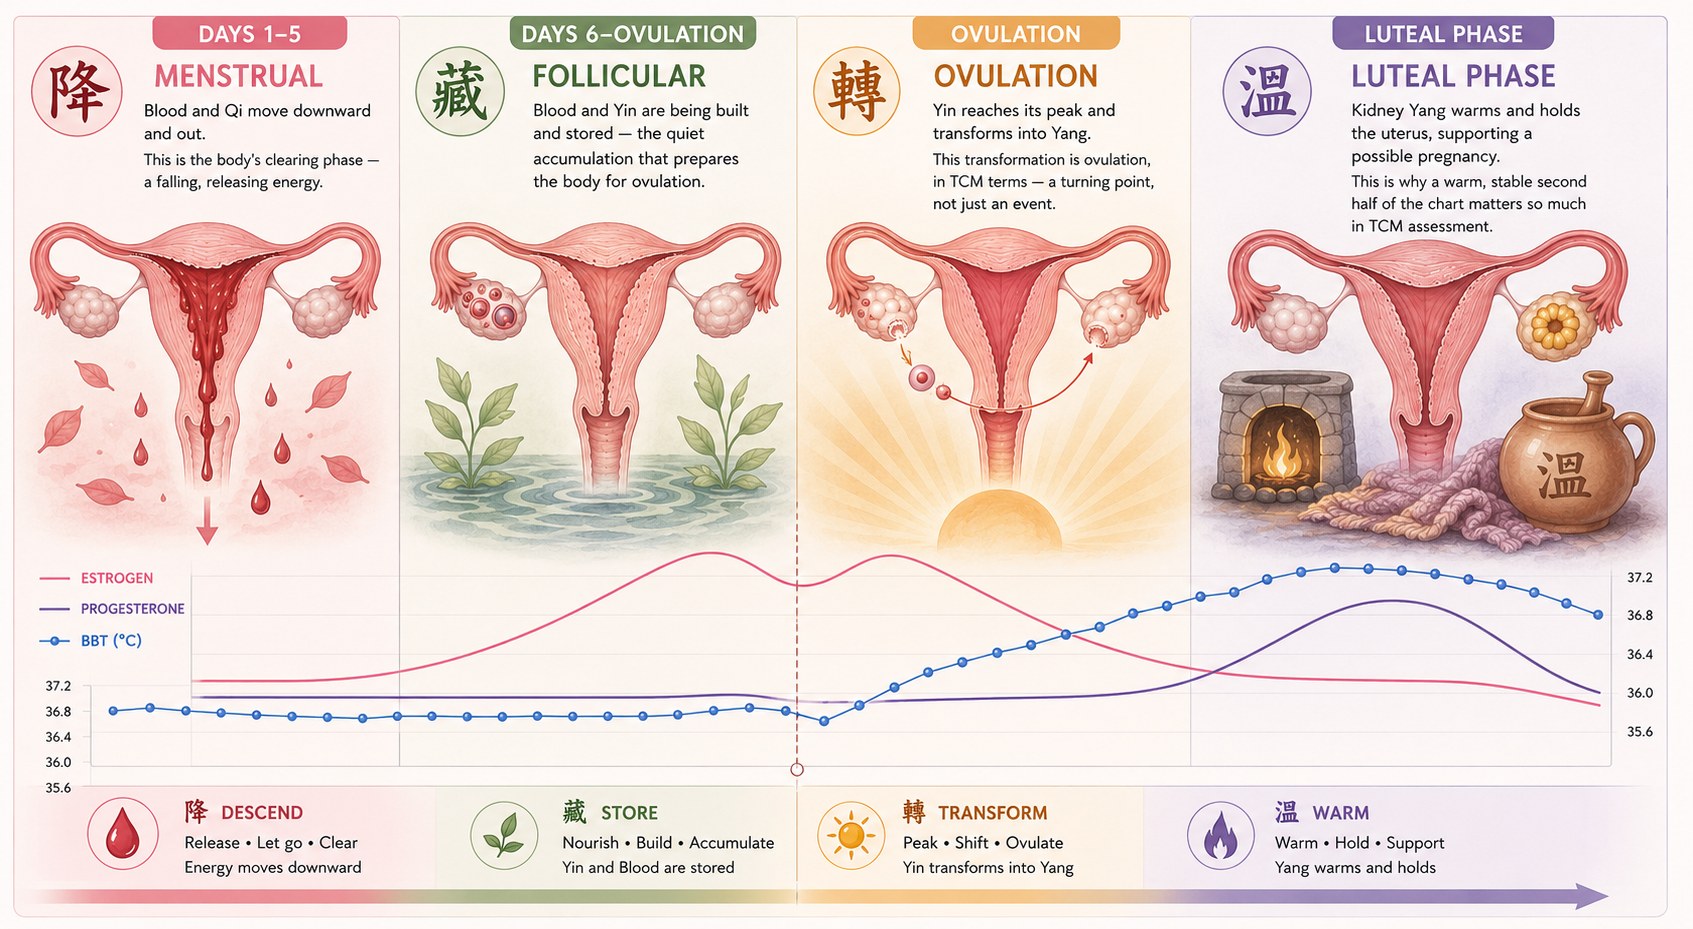
Hormones, BBT and cycle phases. A combined chart showing estrogen, progesterone, and basal body temperature across a 28 day cycle, with five phases below: menstrual, follicular, ovulation, luteal, and next period, each with hormone levels and BBT ranges.

Before ovulation

Estrogen is dominant. Estrogen has a mild cooling effect, so BBT sits lower and fairly flat.
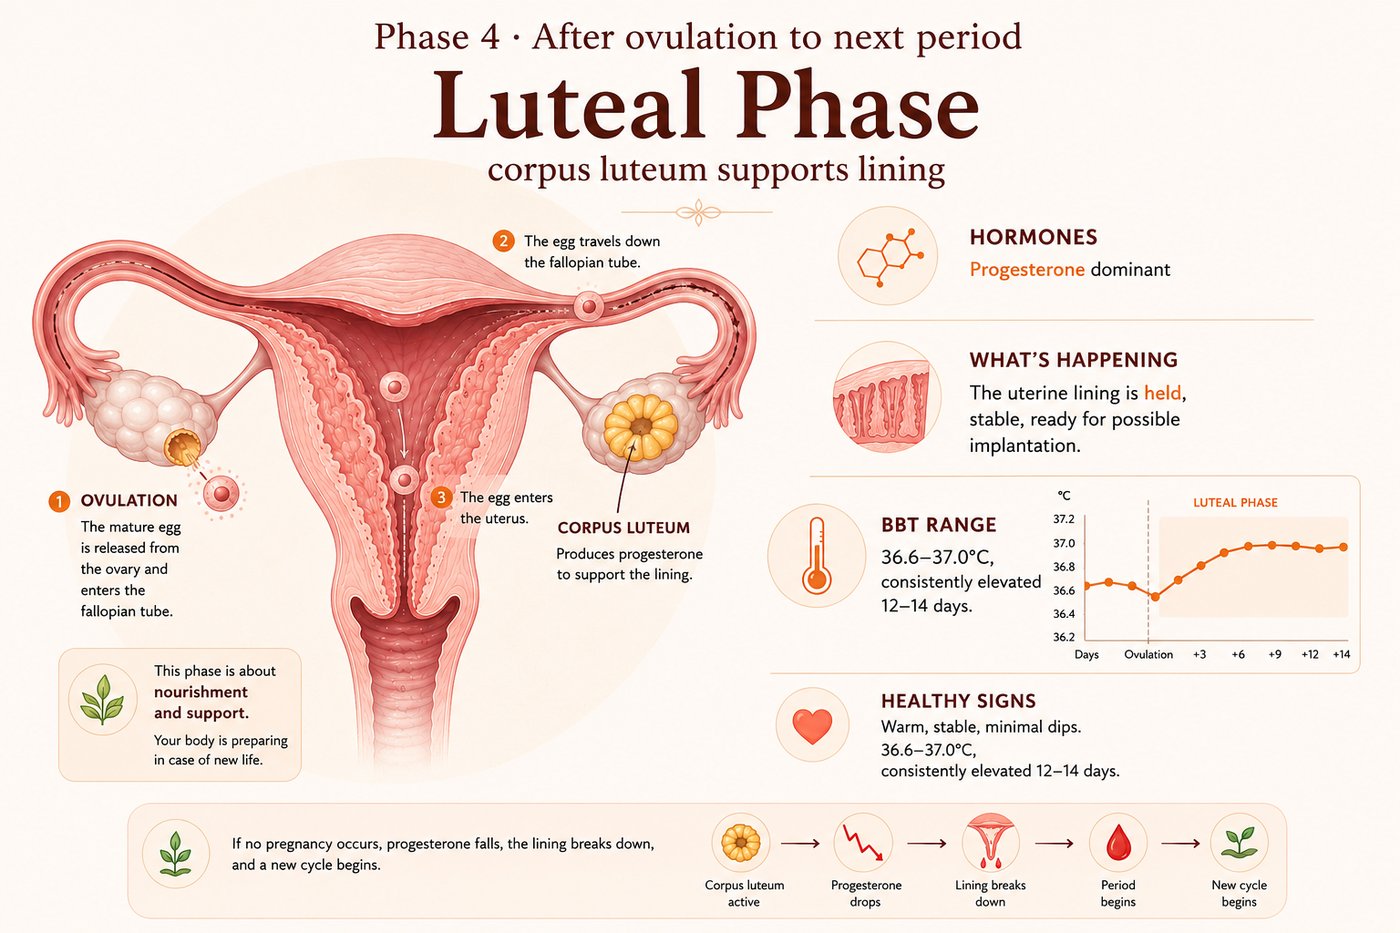
After ovulation

Progesterone takes over. It raises temperature by roughly 0.2–0.5°C, and holds it there for the rest of the luteal phase — the back half of your cycle.

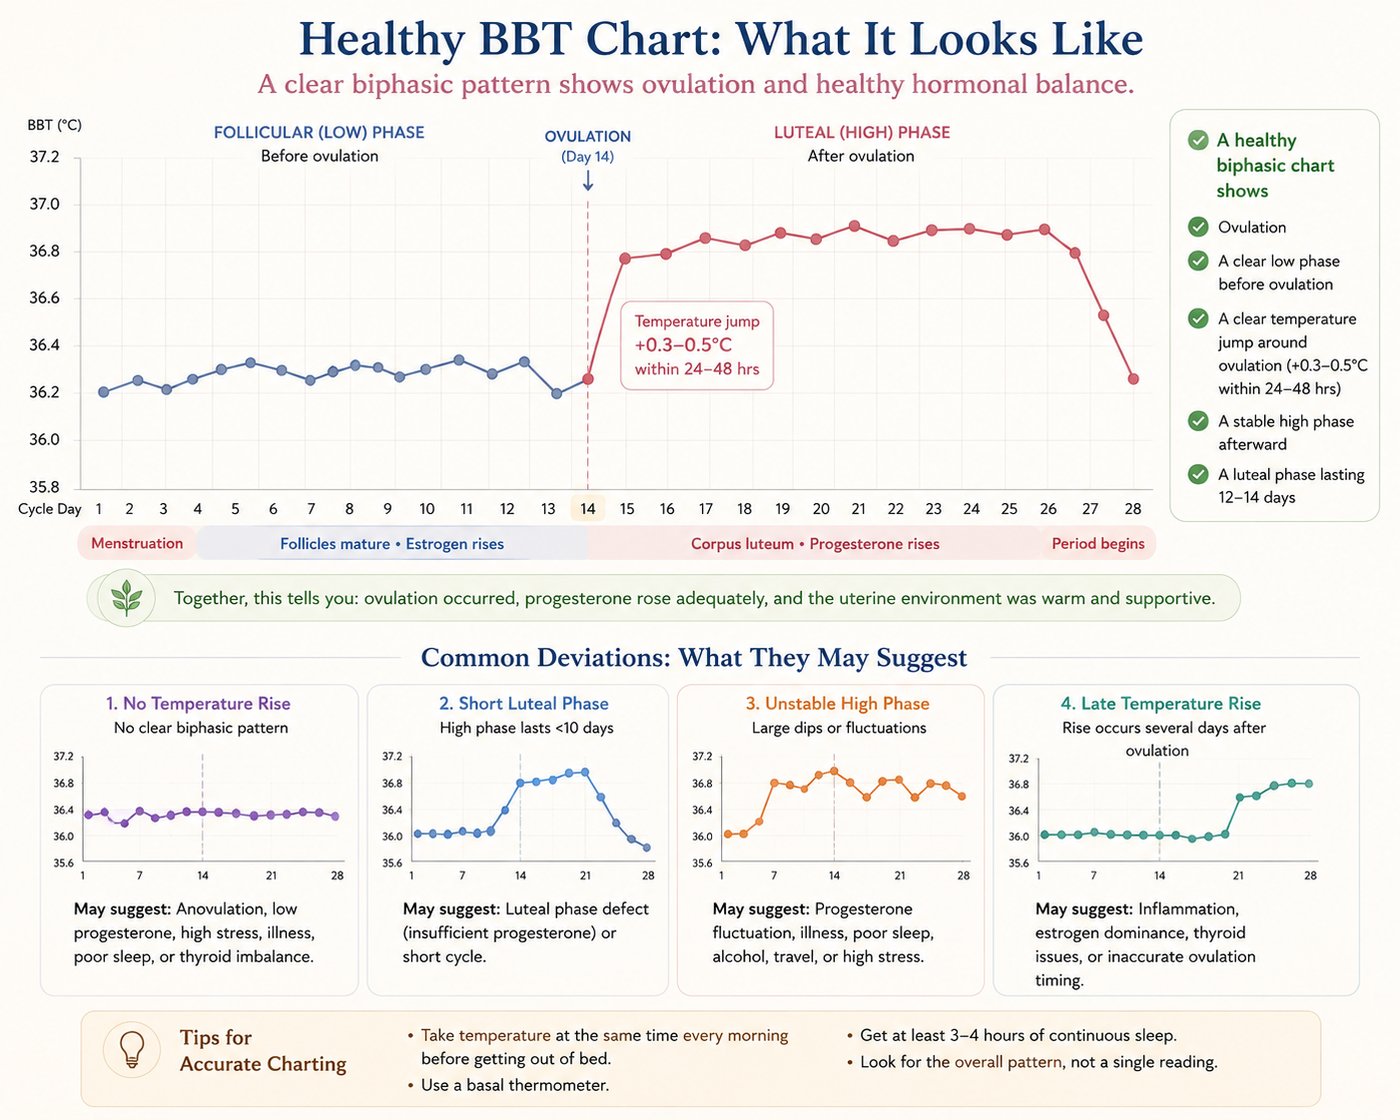
That shift from a lower, flatter pre-ovulation phase to a higher, steadier post-ovulation phase is called a biphasic pattern. Seeing it confirms three things at once: that ovulation happened, roughly when it happened, and that progesterone rose enough afterward to be detected.

The one thing to hold onto: BBT is retrospective, not predictive. The rise tells you ovulation has already occurred — by the time you see it, the fertile window is closing, not opening. It's a confirmation tool, not an early-warning system. Ovulation predictor kits or cervical mucus tracking are better suited to forecasting ahead.

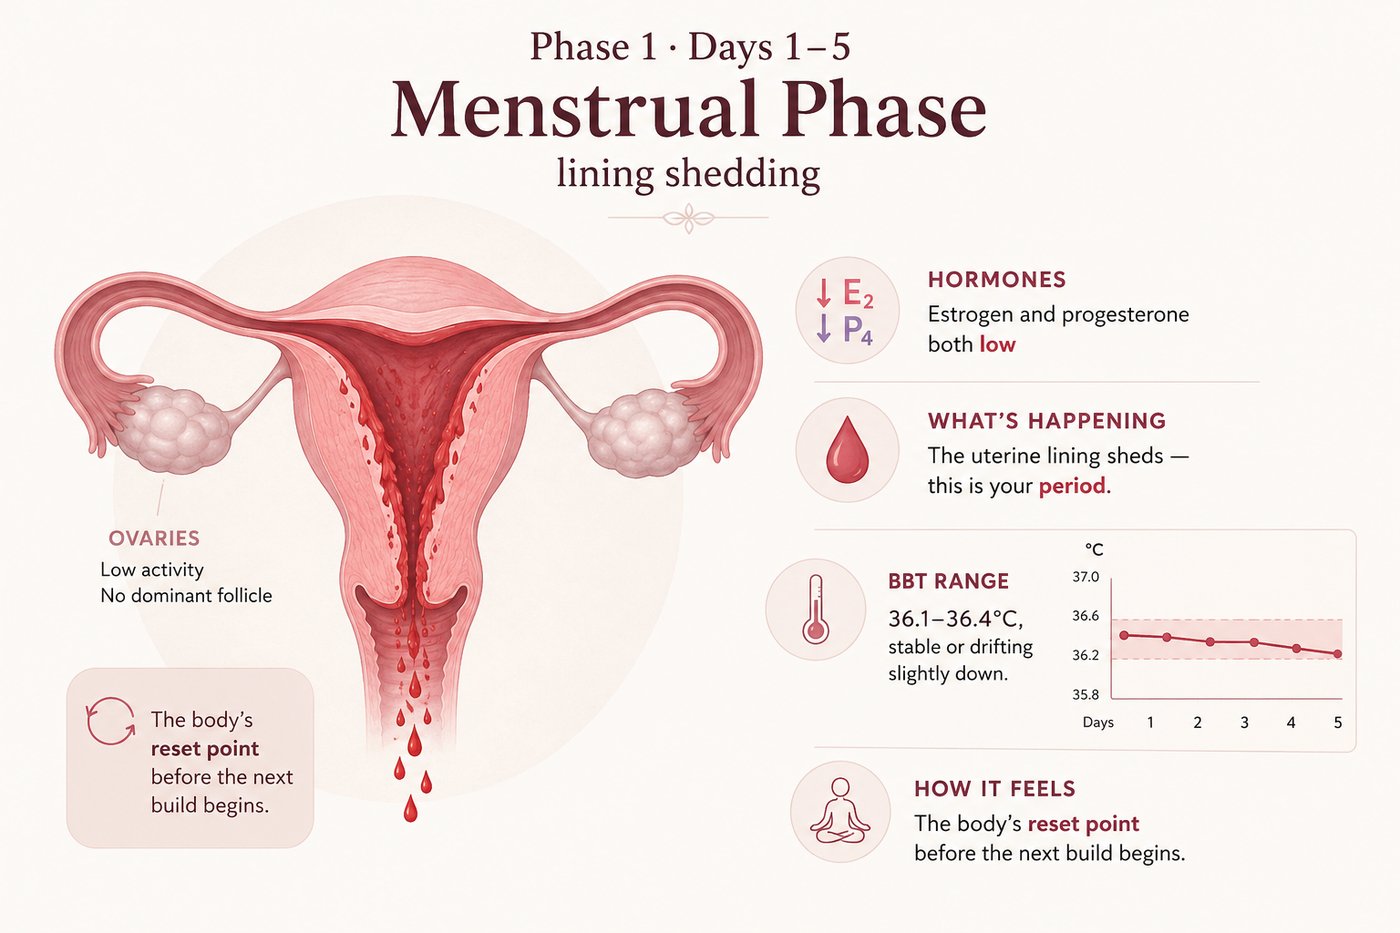
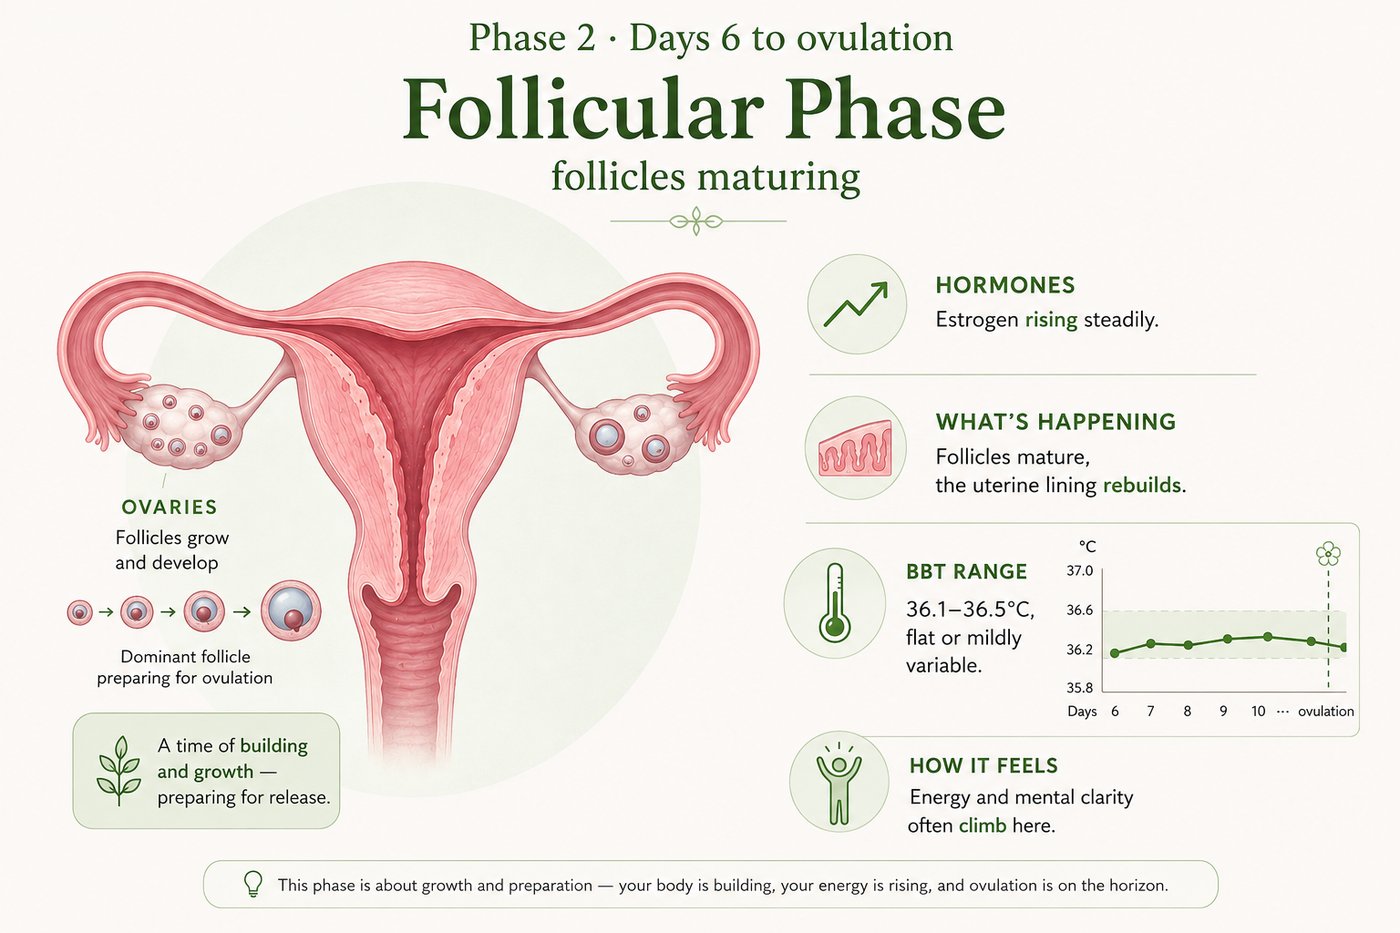
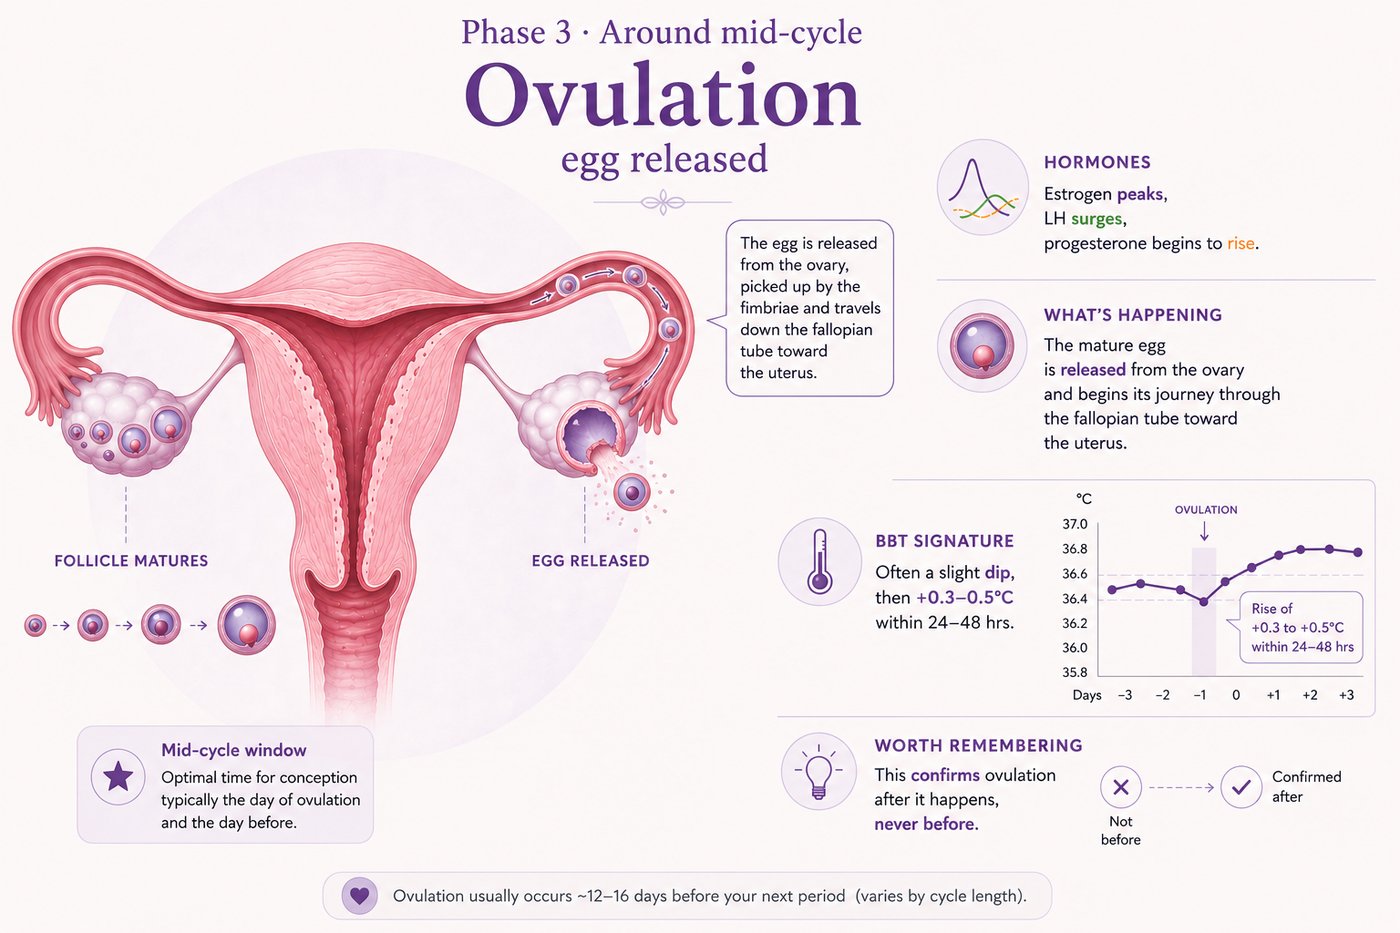
The four phases, hormone by hormone

Phase 1, Menstrual phase: days 1 to 5. Estrogen and progesterone both low. The uterine lining sheds — this is your period. BBT 36.1 to 36.4°C, stable or drifting slightly down. The body's reset point before the next build begins.
Phase 2, Follicular phase: days 6 to ovulation. Estrogen rising steadily. Follicles mature, the uterine lining rebuilds. BBT 36.1 to 36.5°C, flat or mildly variable. Energy and mental clarity often climb here.
Phase 3, Ovulation: around mid-cycle. Estrogen peaks, LH surges, progesterone begins to rise. The mature egg is released. BBT often a slight dip then a rise of 0.3 to 0.5°C within 24 to 48 hours. Confirms ovulation after it happens, never before.
Phase 4, Luteal phase: after ovulation to next period. Progesterone dominant. The uterine lining is held, stable, ready for possible implantation. BBT 36.6 to 37.0°C, consistently elevated 12 to 14 days. Warm, stable, minimal dips.
02 · The practical part

How to measure BBT correctly

A temperature reading is only as useful as the conditions around it.

BBT moves in tenths of a degree. Small inconsistencies in how you take it can hide or fake the very pattern you're trying to see — so the method matters as much as the number.

01

Use a basal thermometer

One that reads to two decimal places (e.g. 36.42°C). A regular fever thermometer isn't precise enough to catch the 0.2–0.5°C shift you're looking for.

02

Take it the moment you wake — before anything else

Before sitting up, talking, checking your phone, or getting out of bed. Keep the thermometer on your nightstand so you can reach it without moving much.

03

Aim for at least 3 hours of continuous sleep beforehand

Less than that, and the reading reflects disrupted sleep more than your hormonal baseline.

04

Take it at roughly the same time each morning

Within about a 30-minute window if possible. Temperature naturally drifts across the early morning hours, so consistency matters more than which exact time you choose.

05

Log it immediately, alongside anything that might explain a swing

Alcohol, a late night, illness, travel, or an unusually warm room can all shift a single reading. Note it next to the number — it'll matter when you're reading the pattern later, not the day.

One reading means nothing. The shape means everything. Don't read any single morning's number in isolation — a chart is a story told over the full cycle, not a snapshot.
03 · Through a TCM lens

What your temperature curve means in Traditional Chinese Medicine

Biomedicine and TCM are describing the same rhythm from two different vantage points.

In Western physiology, the cycle is a story of estrogen and progesterone. In TCM, the same monthly rhythm is read as the ebb and flow of Yin and Yang, carried by Qi (vital energy/movement) and Blood (the nourishing, material substance — related to, but broader than, blood in the biomedical sense).

The four TCM phases mapped to the menstrual cycle. Menstrual phase: descend — blood and Qi move downward and out, the body's clearing phase. Follicular phase: store — blood and Yin are built and accumulated, preparing for ovulation. Ovulation: transform — Yin peaks and transforms into Yang, a turning point. Luteal phase: warm — Kidney Yang warms and holds the uterus, shown alongside estrogen, progesterone, and BBT curves across the same four phases.

Symptoms, in TCM terms

These are starting points for a conversation with your practitioner, not a self-diagnosis. The same symptom can have more than one underlying pattern.

Cramping or sharp pain → often associated with Qi & Blood Stagnation — movement is restricted somewhere in the system.
Fatigue, pale complexion → often associated with Blood Deficiency — not enough nourishing substance to draw on.
Spotting or light flow → often associated with Spleen Qi Deficiency — the system that's meant to "hold" blood isn't containing it well.
Hot flushes, irritability → often associated with Yin Deficiency or Heat — not enough cooling, moistening substance to balance the system's warmth.
04 · Before you chart

What a healthy chart looks like — and what common deviations may suggest

Know what you're looking for before you start logging. It makes the chart far easier to read later.

Healthy BBT chart: a clear biphasic pattern with a low follicular phase, ovulation around day 14, a temperature jump of 0.3 to 0.5 degrees Celsius, and a stable luteal phase of 12 to 14 days. Four common deviations shown: no temperature rise, short luteal phase, unstable high phase, and late temperature rise — each with possible explanations and a tip box for accurate charting.

The same deviations, through a TCM lens

A complementary way to read the same patterns above. Each has several possible explanations — a single unusual cycle is normal; a pattern repeating across 2–3 cycles is what's worth bringing to your practitioner.

No temperature rise

High stressHypothalamic suppressionSevere Qi/Blood deficiency

Short luteal phase

Progesterone deficiencyKidney deficiencyPoor uterine support

Unstable high phase

StressIrregular sleepSpleen Qi deficiencyDigestive weakness

Late temperature rise

Delayed ovulationYin deficiency heat (if pre-ovulation temps run high)Qi stagnation
Track for at least 2–3 consecutive cycles before drawing conclusions. One cycle can be thrown off by travel, illness, or simply a stressful week — it rarely tells the full story on its own.
05 · Your chart

Log your cycle, see the pattern

Enter your daily readings below. Everything stays in this browser tab — nothing is saved, stored, or sent anywhere. Refreshing the page clears it.

This tool is educational and does not diagnose or replace individualised assessment by a qualified practitioner. If you have concerns about your cycle or fertility, please discuss your chart with your TCM practitioner or doctor. — Fion Wellness Academy